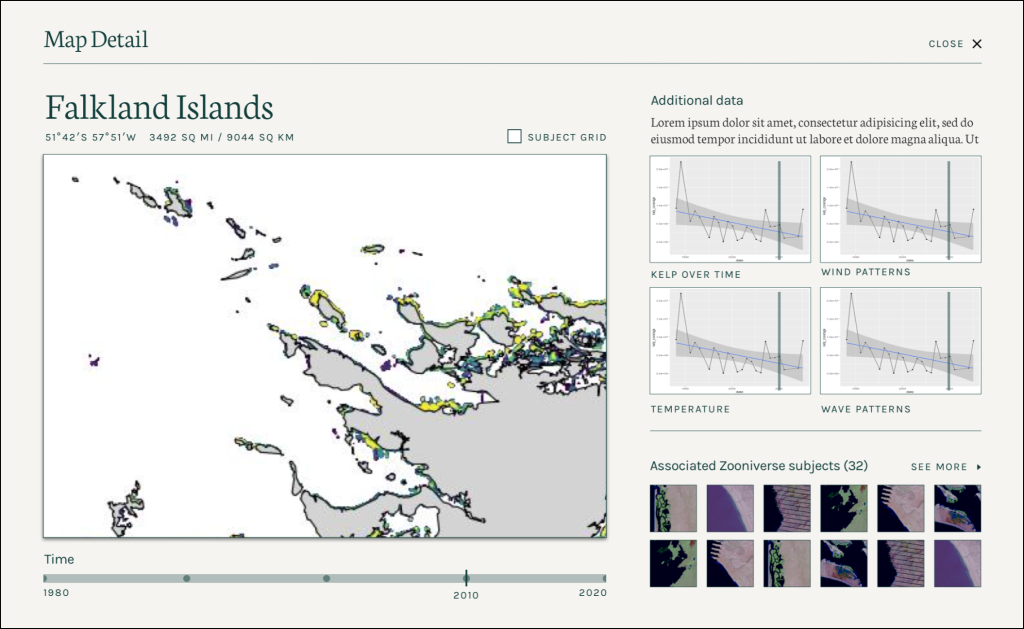
The Mapping Visualization Tools app was created to visualize temperature data on giant kelp forests for the Floating Forests citizen science project. The Floating Forests team used Zooniverse’s platform to analyze Landsat satellite images with the help of hundreds of Zooniverse volunteers, thus gathering temperature data on multiple kelp forests across the world. With the completion of the data collection, the Visualization Tools app was built in order to help the researchers analyze and interpret the final datasets.
As the lead back-end developer for the project, I created a new database on Zooniverse’s PostgreSQL database server to store project data, loaded up the existing project data, and configured an Azure Functions app to connect to the database. The Azure Functions API endpoints allow data to be requested for a specific area of the map, specified by a latitude and longitude range. These endpoints are used by the front-end app to visualize the data.
You can check out the app overview page on Github for more information about the project as a whole. You can also view the code for the Azure Functions app and the database configuration on the back-end app github repo.
Tools:
– Azure Functions
– Node.js
– PostgreSQL
– Yarn
– Docker
- Code github.com/zooniverse/mapping-viz-functions
- Tools Azure Functions, Node.js, PostgreSQL, Yarn, Docker